DART is a weather-aware, runway-to-runway, superfast-time National Airspace System (NAS)/Air Traffic Management (ATM) simulator model.
DART can process a highly complex day-in-the-NAS scenario with 50,000 flights, major airports, their runways, weather-dependent runway relationships, departure/arrival procedures, hundreds of sectors, weather, reroutes, aircraft sequencing, spacing, delays, cancellations, diversions and a multitude of Traffic Management Initiatives (TMIs) in two minutes on a standard PC—i.e., many times faster than competing products, without sacrificing simulation accuracy. While other models pre-process sector and runway capacities as a stand-in for weather impact, DART evaluates the location and intensity of weather (forecast or actual) and, in addition to adjusting airspace and airport capacity, will create operationally realistic “pathfinding” for tactical weather avoidance. Significant effort is applied to ensure proper DART model validation vs. historical observations.
In addition to system-wide simulation scenarios, DART can be used for smaller-scale, more targeted airport / terminal airspace simulations and airspace design studies. It allows for efficient study setup and data import (such as, for instance, departure / arrival procedures) and provides a rich visualization environment for airspace analysis. Processing time for localized simulations (several thousand flights) is around 20 seconds for a complete day-of-operation scenario. This allows for extensive Monte-Carlo type simulations and rapid turnaround for airspace design alternatives. Flight tracks and other model outputs can in turn be exported to environmental or workload analysis models.
DART inputs include:
DART outputs include:
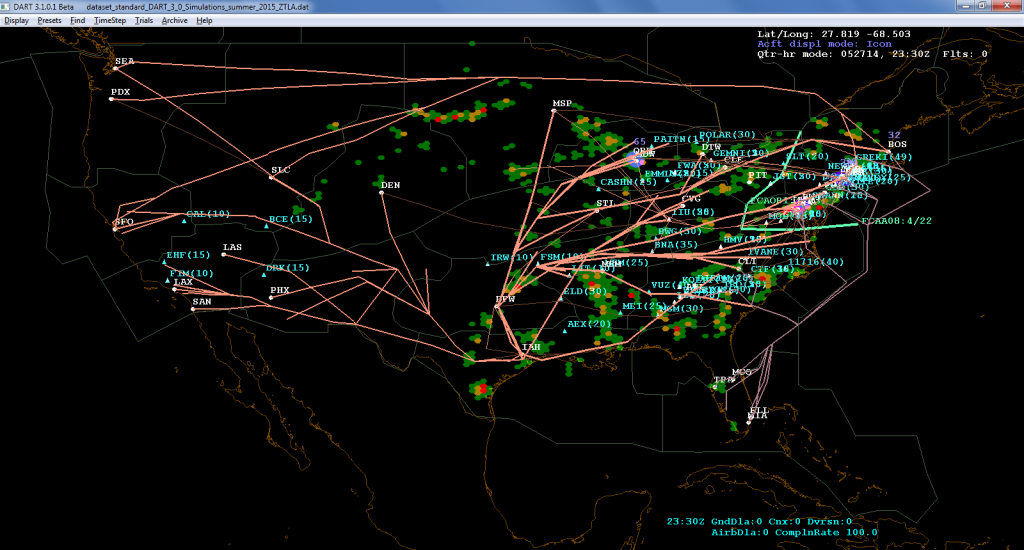
TMI visualization in DART (all traffic is present but hidden). Playbook and other strategic reroutes are shown as pink/magenta routes; MIT restrictions are shown in light blue; Flow Constrained Areas (FCAs) for active AFPs are shown in light green (northeast U.S.), GDPs in darker blue (e.g. arrival rate of 32 at Boston (BOS)); GSs shown as blue circles around affected airports, for example Chicago O’Hare (ORD). This view is dynamic and changes every 15 min.
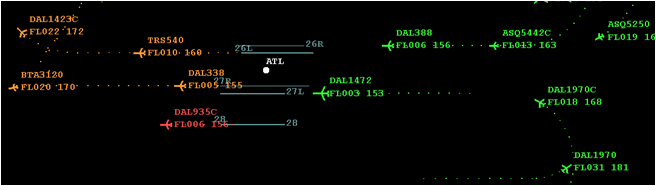
Traffic departing from and landing on parallel runways at Atlanta (ATL) airport
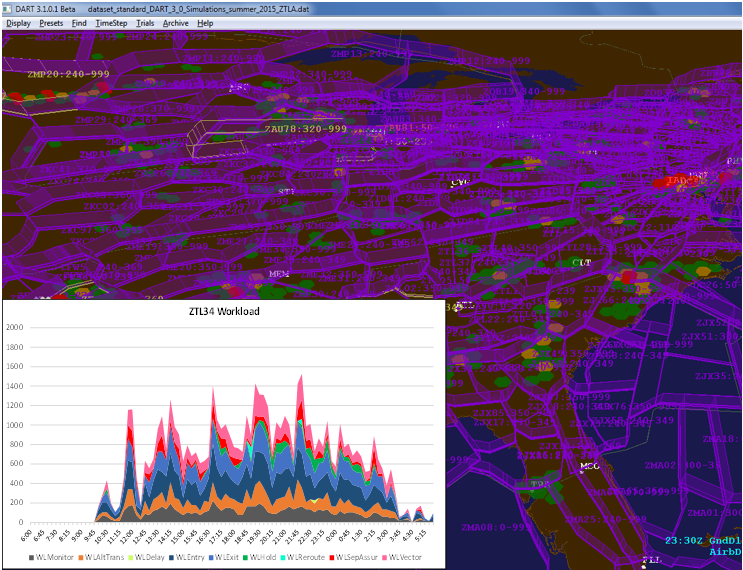
Upper airspace sectors in the eastern portion of the U.S. shown in 3D. The inset (bottom left) shows a sample workload component representation for an individual sector. Tasks like traffic monitoring, sector entry and exit, altitude transitions, speed control, conflict detection, radar vectoring and holding are assigned specific times according to published data, and detailed model outputs can also be imported into an external workload model for further analysis.
As a system-wide, scalable model that also supports a significant level of detail, DART can be used in a variety of applications, including:
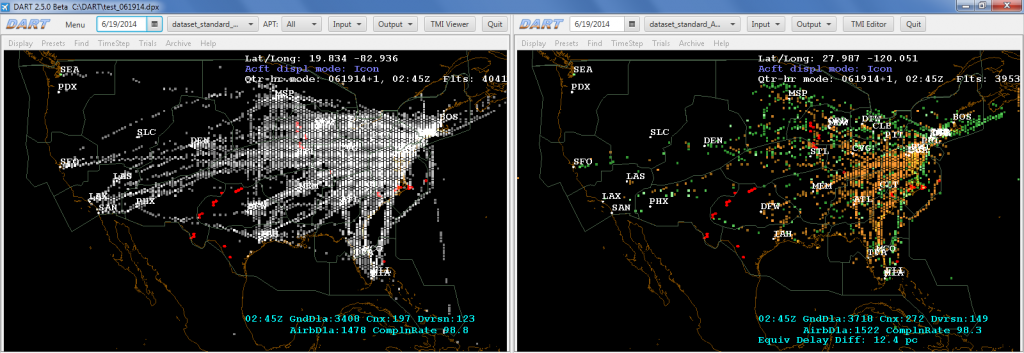
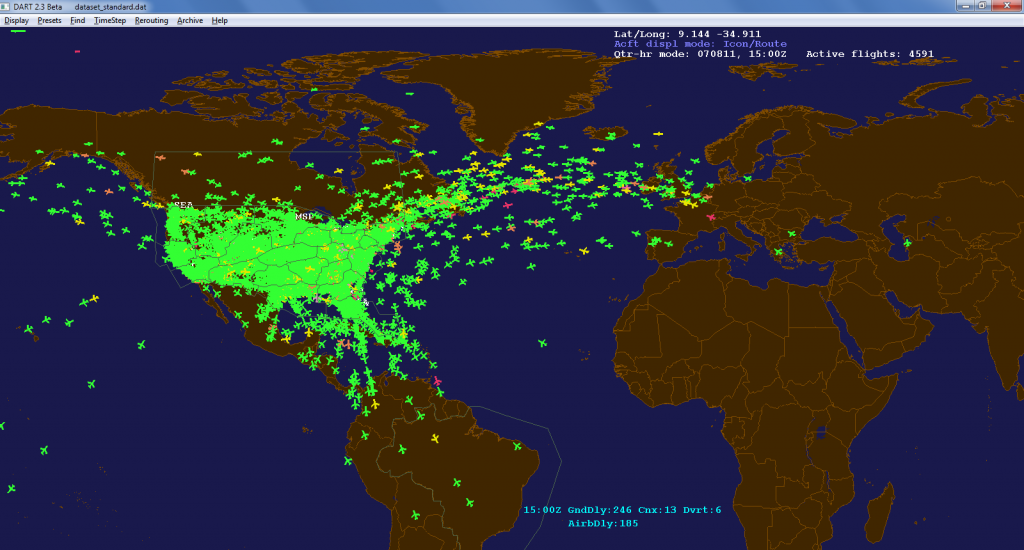
DART aggregate delay visualization example: a synchronized side-by-side simulation of two alternatives for the same day. On the left, the baseline scenario’s cumulative Equivalent Ground Delay (EGD) is shown. On the right, an alternative scenario is tested, with different TMIs. The EGD differences vs. Baseline are highlighted: areas with lower EGD (less cost; better) are in green, and areas of the airspace with higher EGD (more cost; worse) are in orange. The EGD components: total hours of ground and airborne delay, cancellations and diversions, are shown at bottom right corner of each screen.
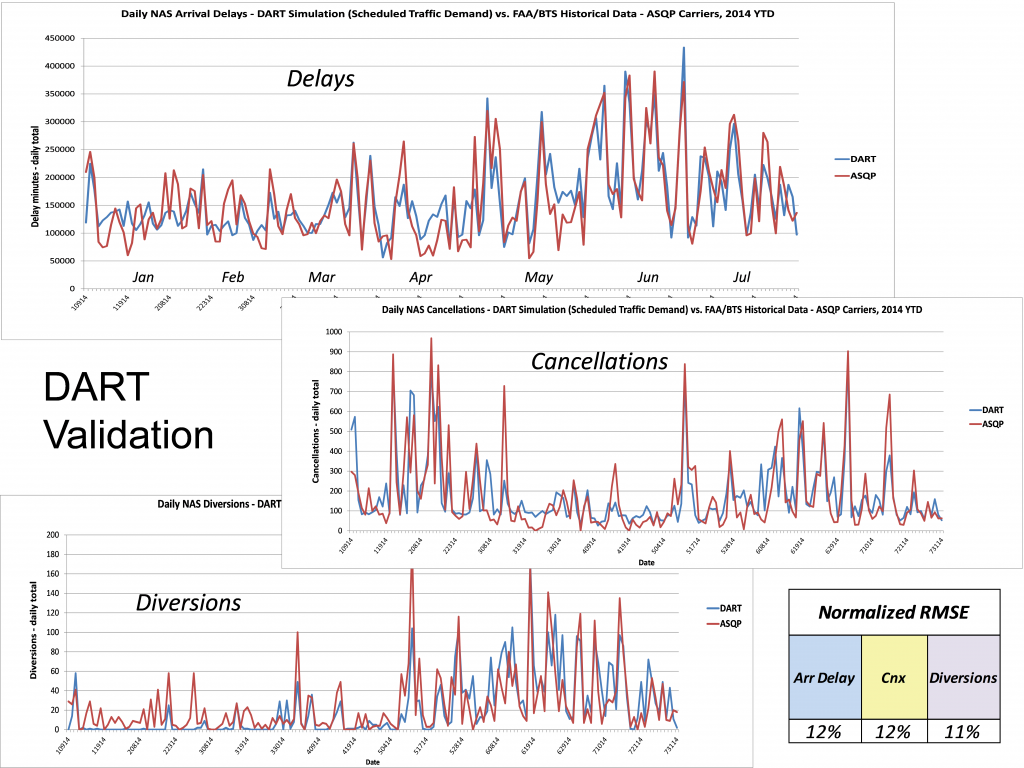
DART validation example. NAS-wide delays, cancellations and diversions (daily totals) are shown for DART (blue graphs), as well as for the FAA Airline Service Quality Performance (ASQP) actual data for the same days (red graphs) for January to July of 2014. Root Mean Square Error (RMSE) for annualized totals is within 11-12%. Each day’s simulation involved 30,000 to 40,000 flights and took approximately two minutes to complete.